
Statistics on Violent Conflict
Human Rights Statistics
June 21, 2013
Content
1. Historical Overview of Violent Conflict
2. Recent Evolution in the Number of Violent Conflicts, By Type Of Conflict
3. Recent Evolution in the Intensity of Violent Conflicts, By Type of Conflict
4. Numbers on A Selection Of Violent Conflicts
4.1. Israel and Palestine
4.2. Iraq
4.3. Afghanistan
4.4. Syria
2.
1. Historical overview of violent conflict
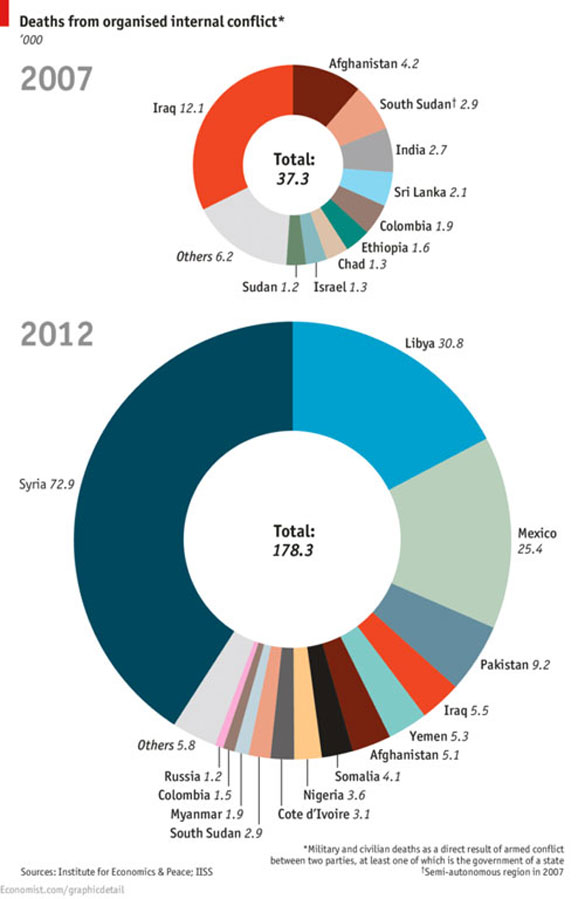
Since there’s no world war or major conflict going on at the moment, the number of war deaths is relatively limited nowadays. Only about 10% of all violent deaths occur as a result of armed conflicts. Whereas more than a million people lose their lives to violence each year, about half of those are suicides and a third are homicides.
Of course, it wasn’t always like that. Since the beginning of recorded history, around 3600 BC, over 14.500 major wars have killed about four billion people, a number that not so long ago equaled the whole of humanity. The wars that took place in the 20th century killed around 200 million people; in the Second World War, 66 million died, compared to 15 million in the First. However, if you count the 50 to 100 million deaths from the 1918 flu pandemic - facilitated by close troop quarters and massive troop movements – WWI is the deadliest conflict in world history.
Since the Second World War, there have been on average about 30 armed conflicts ongoing every year. 90% of casualties in these conflicts have been civilians, compared to 50% in the Second World War and 10% in the First. 128 armed conflicts since 1989 have resulted in at least 250,000 deaths each year.
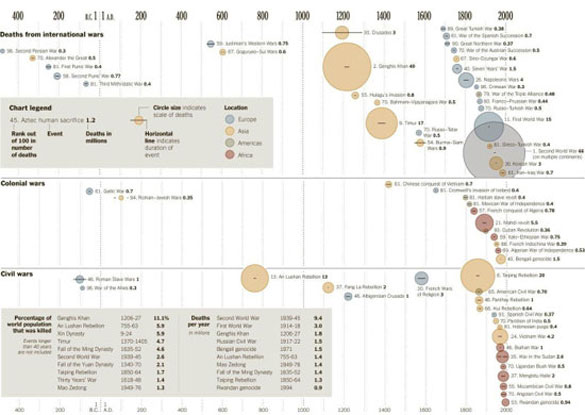
In pre-modern history, the worst war was probably the conquests by Genghis Khan, which killed 40 million people, or 11% of global population. Indeed, when relating the numbers killed during a certain conflict, one should probably relate these numbers to the total population of the world at the time of the conflict; this will give you a totally different raking of “worst conflicts”.
Here’s an overview of the worst wars in history – in absolute numbers (note: I deleted deaths from institutional oppression, failed states and despots from this chart and, as a result, the ranking numbers show gaps; the deleted parts can be found here):
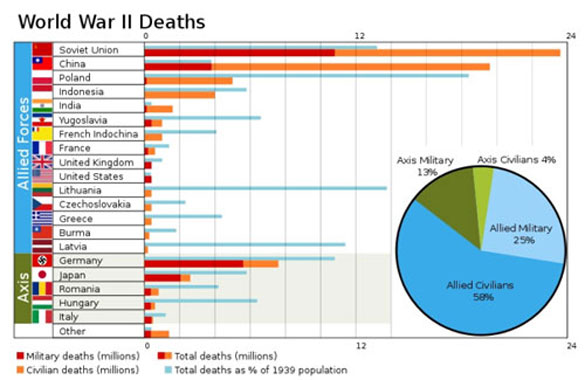
Here’s an overview of the number of casualties in one of histories worst violent conflict, WWII:
2. Recent evolution in the number of violent conflicts, by type of conflict
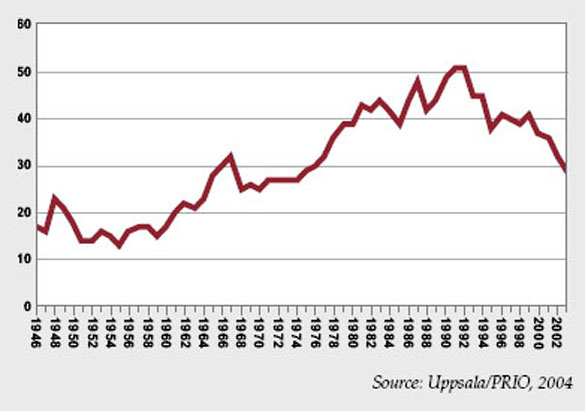
Recently, there has been a drop in the number of wars and in their intensity in terms of their deadliness. This graph gives the number of armed conflicts since the Second World War, including inter-state wars, intra-state wars (civil wars) and colonial wars:
The exception is, as often, Sub-Saharan Africa, where the trend continues upward. Africa loses around $18bn per year due to wars, civil wars, and insurgencies. On average, armed conflict shrinks an African nation’s economy by 15%, and this is probably a conservative estimate (source).
The following graph – a stacked graph – splits this out into the three categories of war mentioned before. As one can see, civil wars are by far the most common kind:
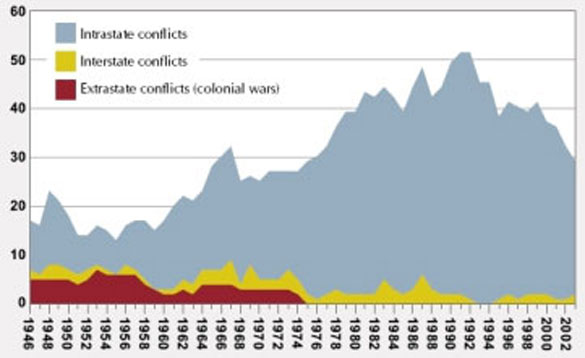 The graph does not include ethnic or other conflicts where neither warring party was a state, nor does it include cases of “one-sided” violence such as genocide.
The figure is a stacked graph, meaning that the number of conflicts in each category is indicated by the depth of the band of color. The top line therefore indicates the total of number of conflicts of all types in each year, corresponding to the first graph just above this one.
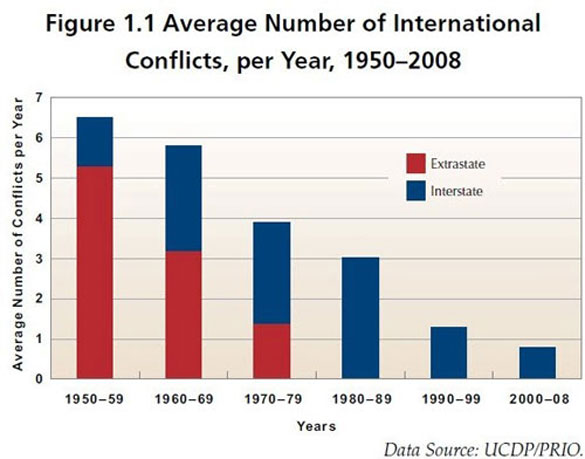
Here’s another data set on the number of conflicts (not including civil wars):
 3. Recent evolution in the intensity of violent conflicts, by type of conflict
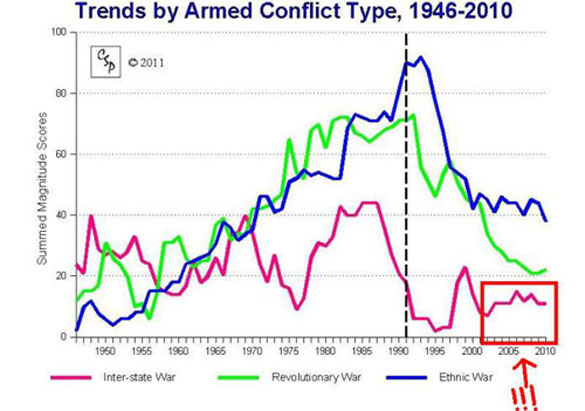
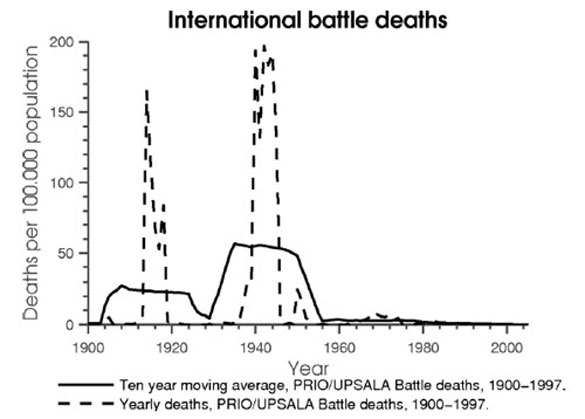
The number of conflicts has decreased but also their intensity:
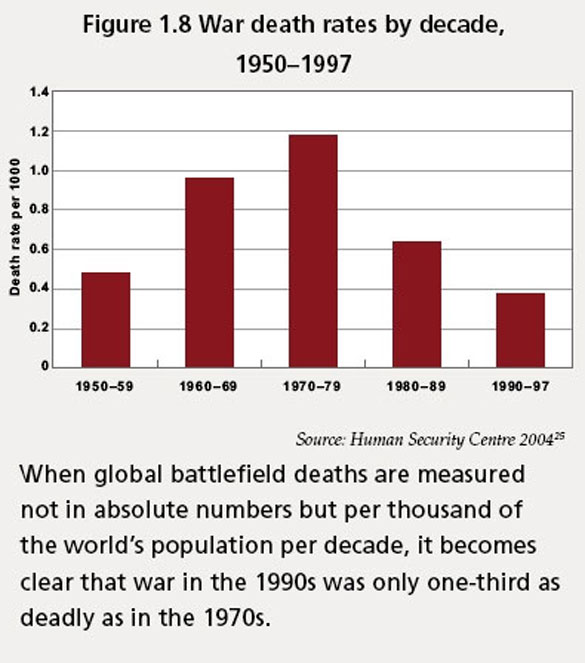
In fact, the last decade has seen fewer war deaths than any decade in the past 100 years, based on data compiled by researchers Bethany Lacina and Nils Petter Gleditsch of the Peace Research Institute Oslo. Worldwide, deaths caused directly by war-related violence in the new century have averaged about 55,000 per year, just over half of what they were in the 1990s (100,000 a year), a third of what they were during the Cold War (180,000 a year from 1950 to 1989), and a hundredth of what they were in World War II. If you factor in the growing global population, which has nearly quadrupled in the last century, the decrease is even sharper. Far from being an age of killer anarchy, the 20 years since the Cold War ended have been an era of rapid progress toward peace. (source, source)
In 2008, an estimated 64.000 were killed as a result of armed conflict.
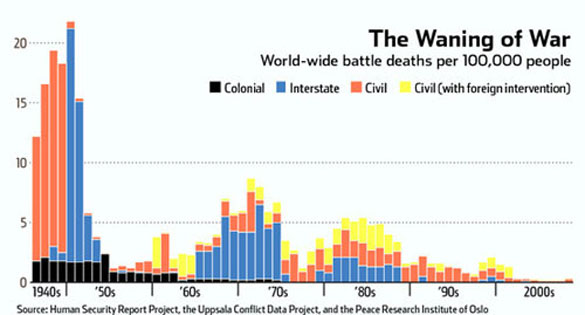
The intensity of wars, measured in terms of their deadliness, has declined even before the number of conflicts started to fall.
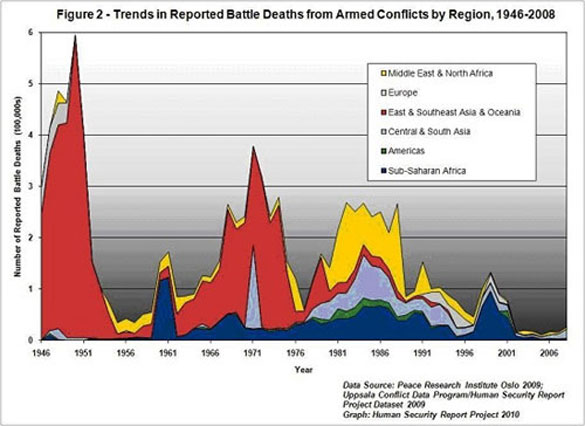
The regional distribution of battle deaths shows a clear concentration in East and South-East Asia, which was the bloodiest region. Recently, however, battle-deaths occur mainly in Africa:
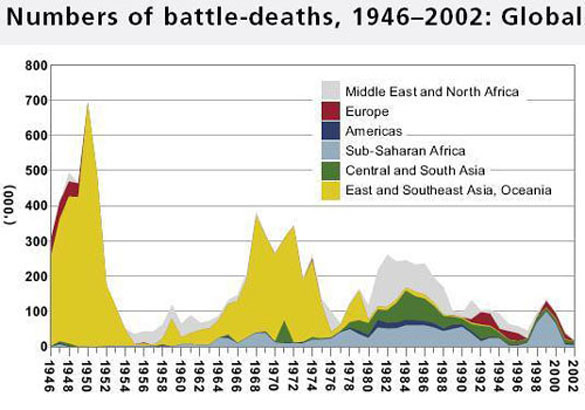 Again this is a stacked graph, meaning that the number of conflicts in each category is indicated by the depth of the band of color. The top line therefore indicates the total of number of conflicts of all types in each year.
Here’s a slightly more up-to-date version:
 We also see a clear improvement over the last decades when the number of battle-deaths is related to the total of the world’s population:
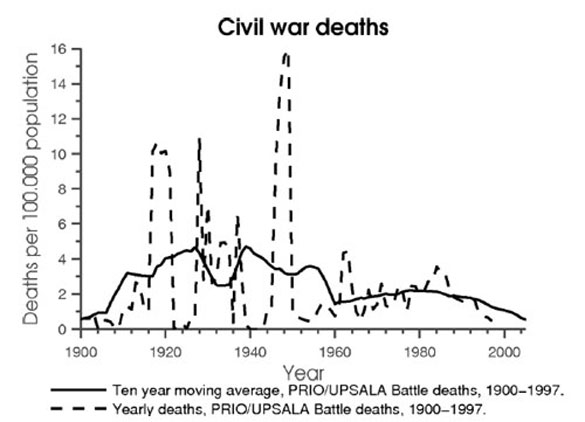
And for civil wars only:
Some data for one particular recent year:
The World Health Organization estimated that 310,000 people died as the result of war in the year 2000. Recent statistics estimate that a majority of that number are civilians. The International Committee of the Red Cross estimated that the ratio of civilian to combatant deaths in violent conflicts since World War II has been 10 to 1. … I don’t know of a single prolonged conflict in the modern day where there are fewer civilian deaths than combatant deaths. It is likely that any long war will have more civilians killed than soldiers. The larger number of deaths has to do with the increased use of firepower, combined with the soldiers’ confusion about who is a combatant and who is a civilian. (source)
However, this assessment is disputed:
Analysis done in 1989 by peace researcher William Eckhardt shows that the ratio of military to civilian war deaths remains about 50-50, as it has for centuries (though it varies considerably from one war to the next). (source)
There’s also another take on things, somewhat less optimistic in terms of the long trend. According to these data, there has been a steady increase in the number of pairwise conflicts between states (data do not include civil wars):
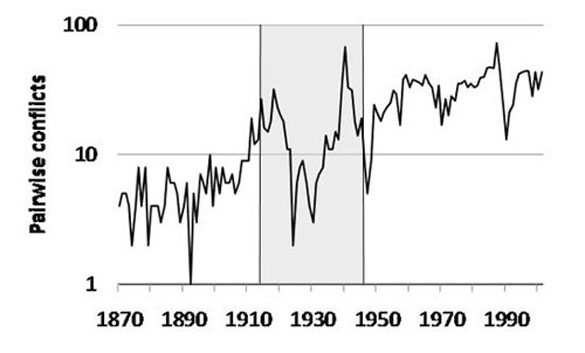 “Conflict” here can mean full-scale shooting wars but also other use of military force or simply the display of force (sending warships and closing borders, for example).
Violent death is of course not the only scourge of war. 26 million people worldwide were internally displaced as a result of armed conflict at the end of 2008. All of the top six countries of origin of refugees in 2008 are locations of armed conflict.
I’ll add some specific data on particular conflicts below:
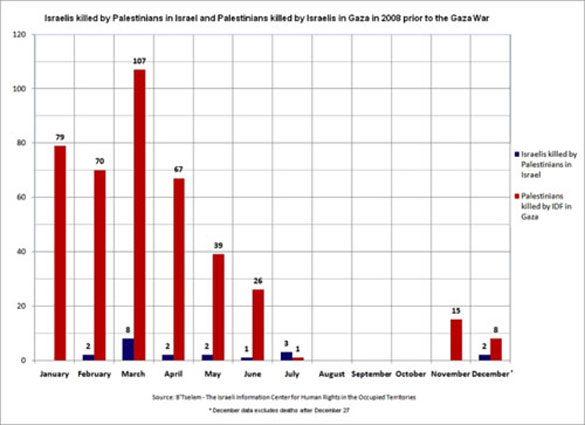
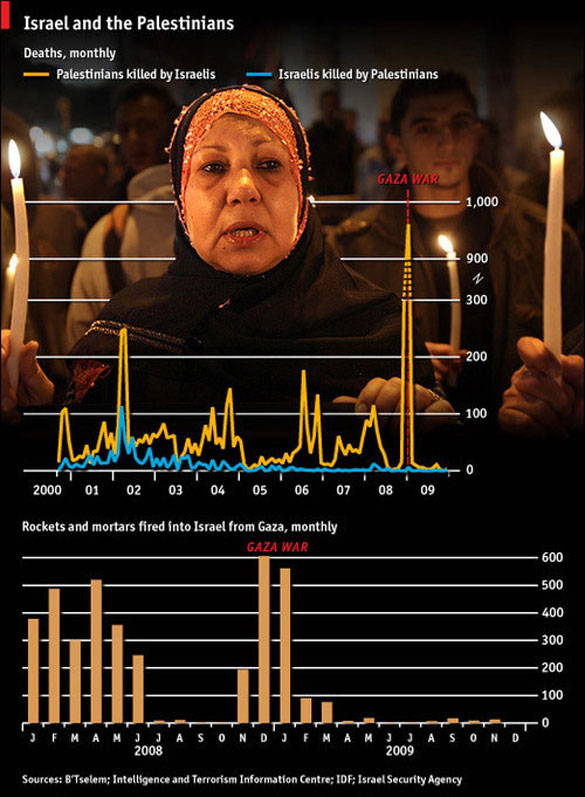
4.1. Israel and Palestine
 4.2. Iraq
The Iraq War was a conflict triggered by an invasion of Iraq by the United States and the United Kingdom from March 20, 2003 to December 18, 2011 though sectarian violence continues and has caused thousands of fatalities.
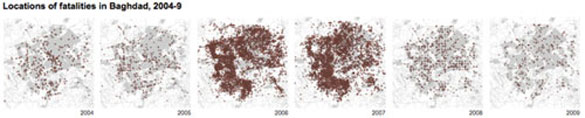
The Wikileaks Iraq war logs have made it possible to map the occurrence of violent death during the Iraq war:
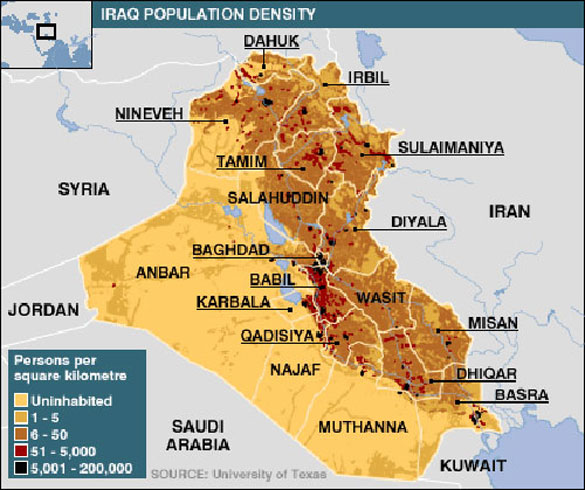
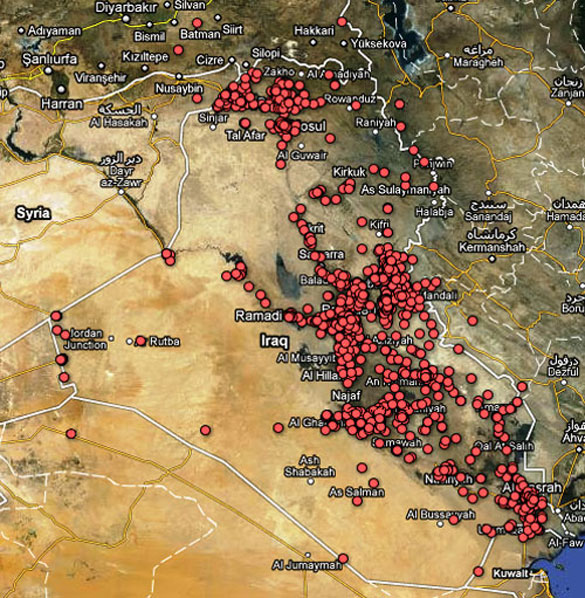 This follows more or less closely the population density of Iraq, meaning that the war has been equally horrible for everyone, with the exception of some parts of the north of the country where violent death has been somewhat less common:
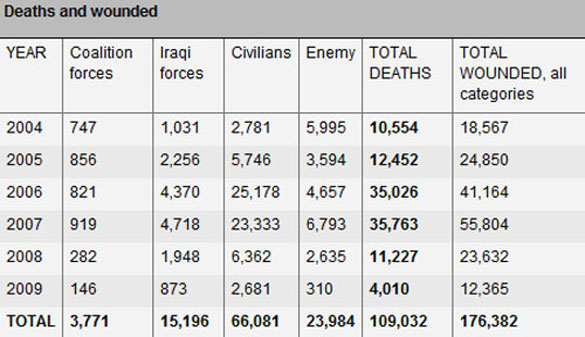
Some key figures:
• The Wikileaks database records 109,032 deaths in total, 66,081 civilians, 23,984 insurgents and 15,196 Iraqi security forces. Baghdad alone saw 45,497 casualties. Colation forces lost 3,771 soldiers in the period covered.
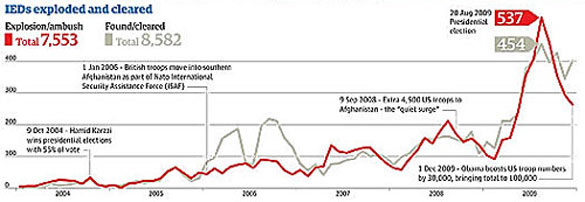
• There were 65,439 IED explosions (improvised explosive devices), resulting in 31,780 deaths. Another 44,620 IEDs were found and cleared.
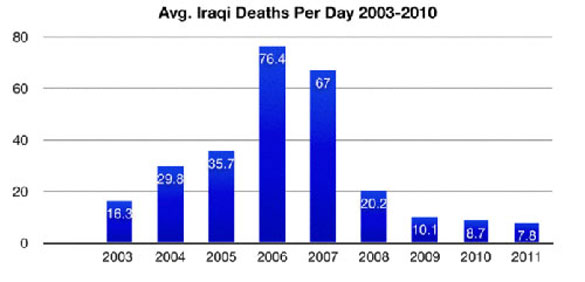
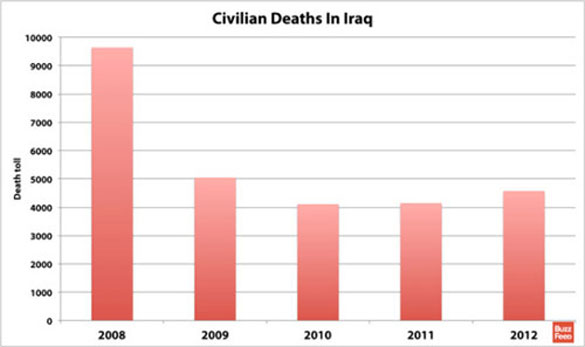
• Here’s how some of these numbers evolved over time:
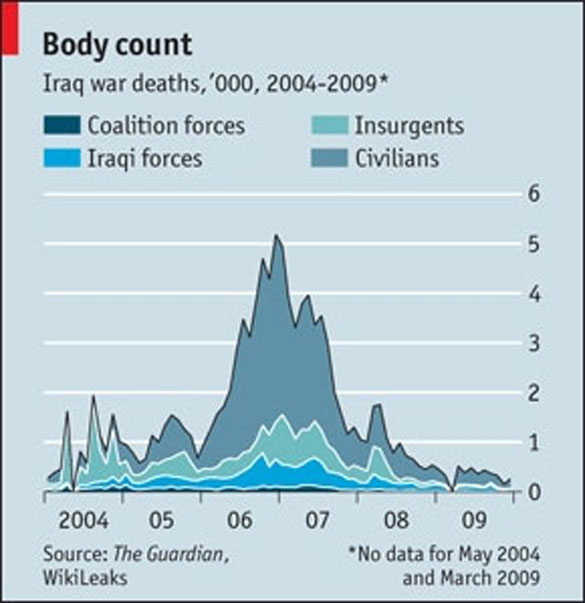 These numbers are probably low estimates because not every event is recorded.
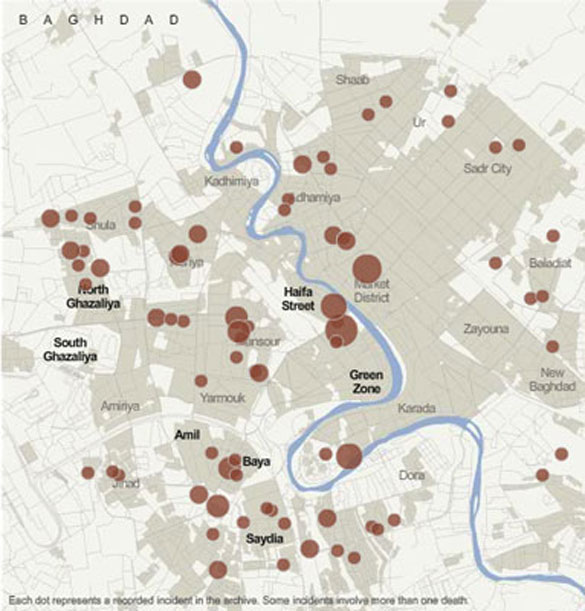
Let’s focus on Baghdad for an instant, the epicenter of violence. December 2006 was the worst month. Below are the details of one of the city’s deadliest days, Dec. 20. There were 114 separate episodes of violence that day, resulting in the deaths of about 160 Iraqi citizens and police officers (an interactive version of the map ishere).
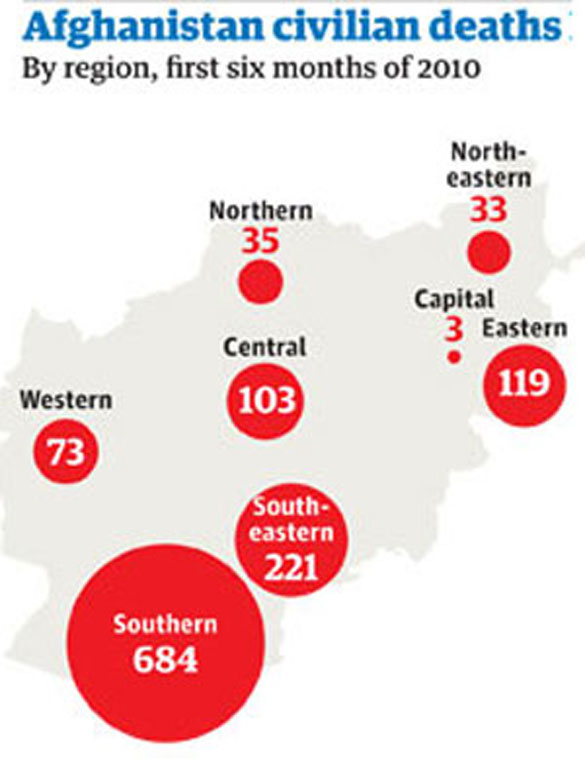
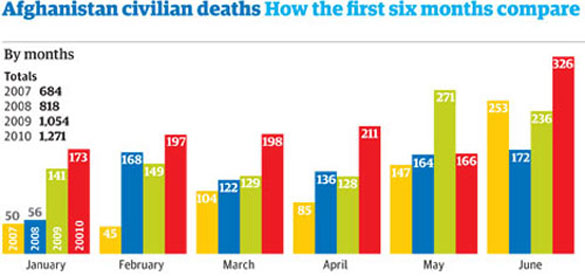
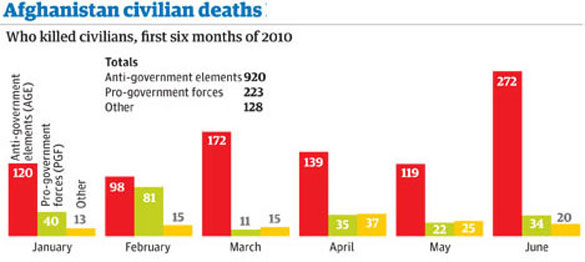
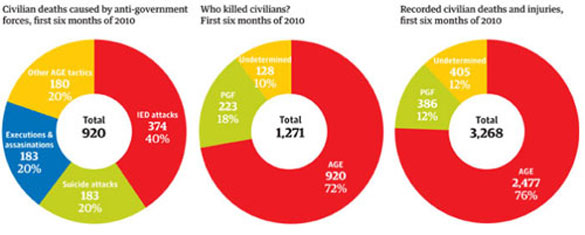
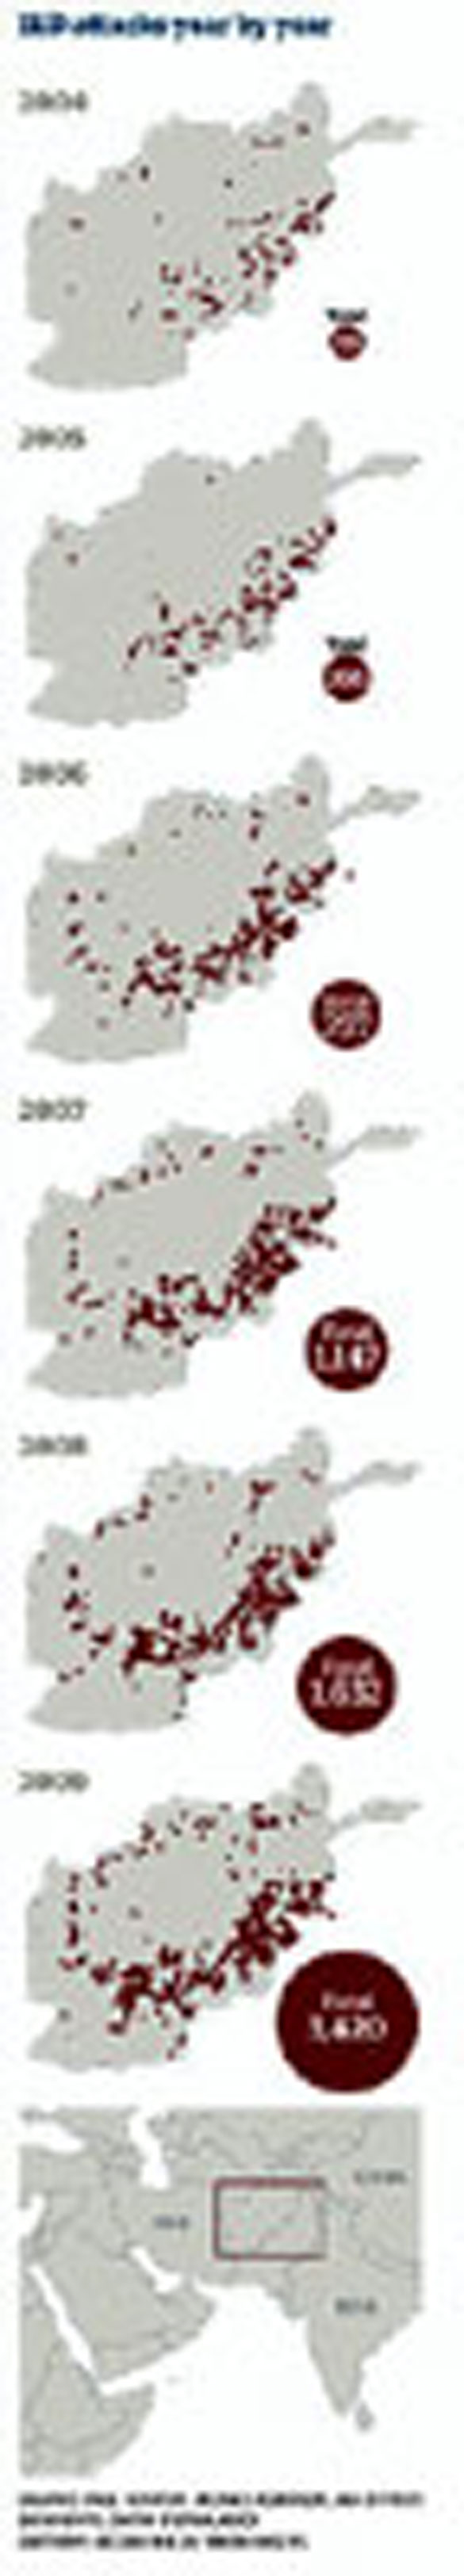
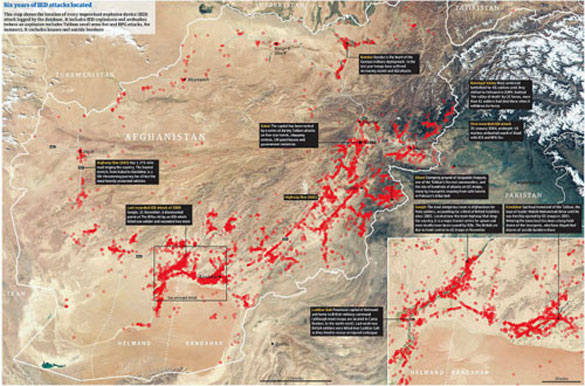
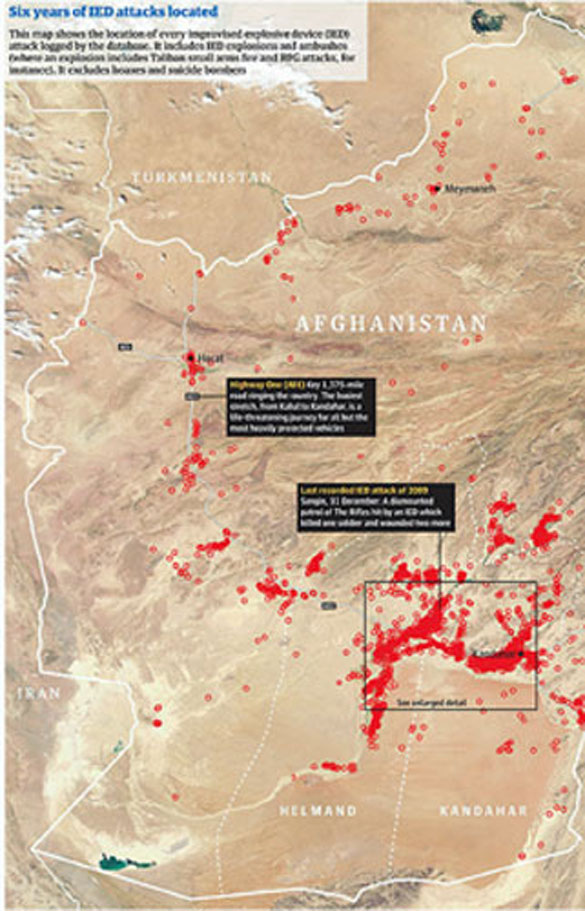
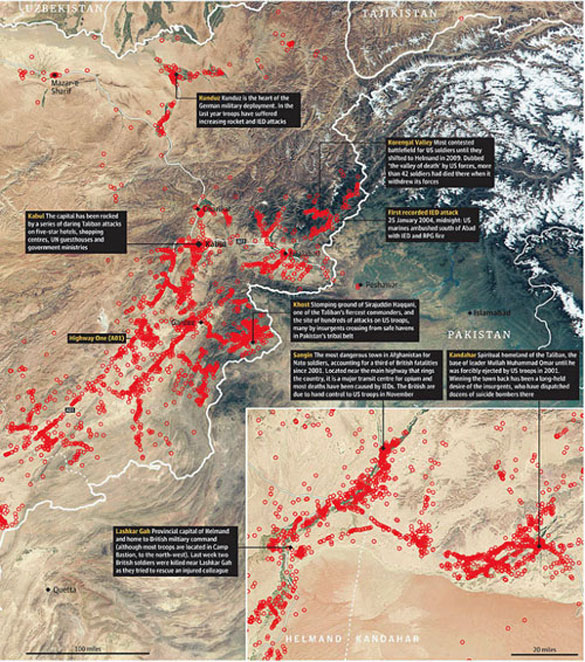
The 2001 invasion of Afghanistan by US and coalition forces has resulted in a decade long conflict with the Taliban.
 Let’s just have a look at Improvised Explosive Devices, the favorite tool of the insurgents. From the Wikileaks Afghanistan war logs, there’s this overview of every roadside bomb and IED attack between 2004 and 2009 (this includes attacks on soldiers and civilians, and only covers roadside bombs, not person- or vehicle-borne suicide bombs) (you can click on some of the images to enlarge):

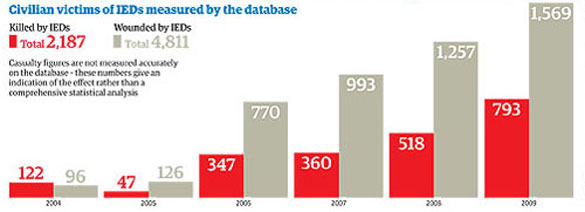
If we select only the IED attacks on civilians, we get this:
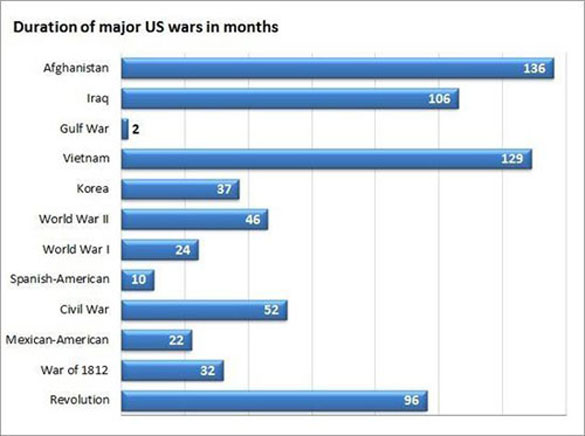
 The war in Afghanistan is now the longest war in U.S. history:
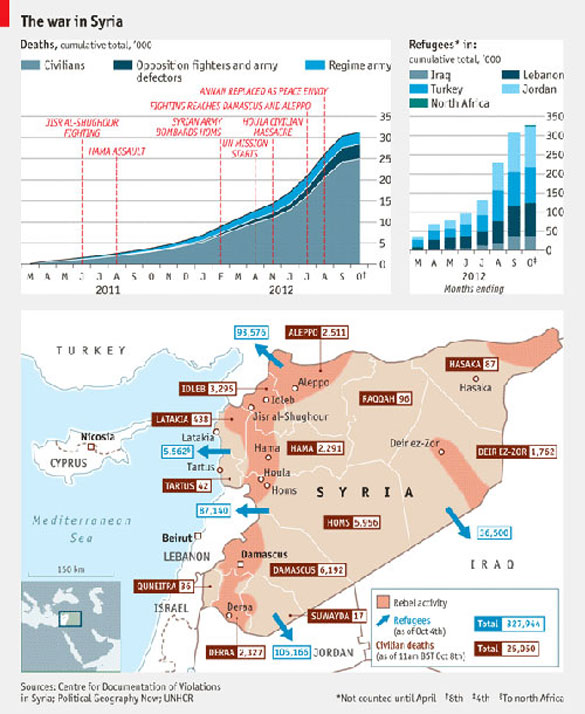
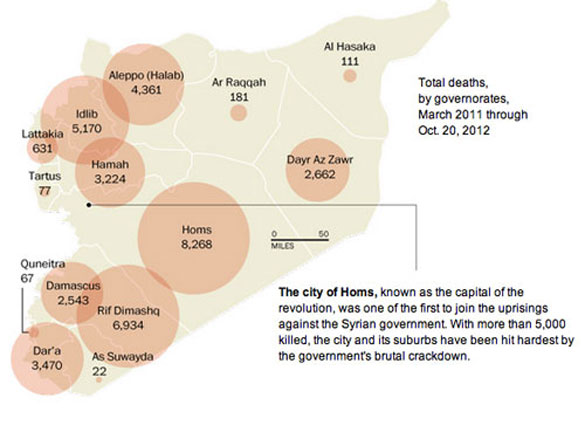
 4.4. Syria
The Syrian civil war, also referred to as the Syrian uprising, is an ongoing armed conflict between forces loyal to the Ba’ath Party government and those seeking to oust it. The conflict began on 15 March 2011 with public demonstrations as part of the wider Arab Spring. Protesters demanded the end to nearly five decades of Ba’ath Party rule, as well as the resignation of President Bashar al-Assad.

Source: http://filipspagnoli.wordpress.com/stats-on-human-rights/statistics-on-war-conflict/statistics-on-violent-conflict/
URL: https://newageislam.com/islam-terrorism-jihad/statistics-violent-conflict/d/12199